
System
Portfolio Intelligence System
Replaced an Excel-and-Streamlit workflow with a single live platform that streams positions from the broker, visualizes the book across themes, and puts research, valuation, and an AI analyst in one place.
Problem
Serious portfolio management tends to sprawl across tools: a spreadsheet for positions, a brokerage terminal for execution, separate scripts for analytics, and a folder of research nobody can search. Every number is a manual copy from somewhere else, so the book is always slightly out of date and impossible to reason about as a whole. The objective was to collapse that fragmented workflow into one live system where every figure traces back to a real source, the entire book is legible at a glance, and analysis, research, and execution live in the same place.
Approach
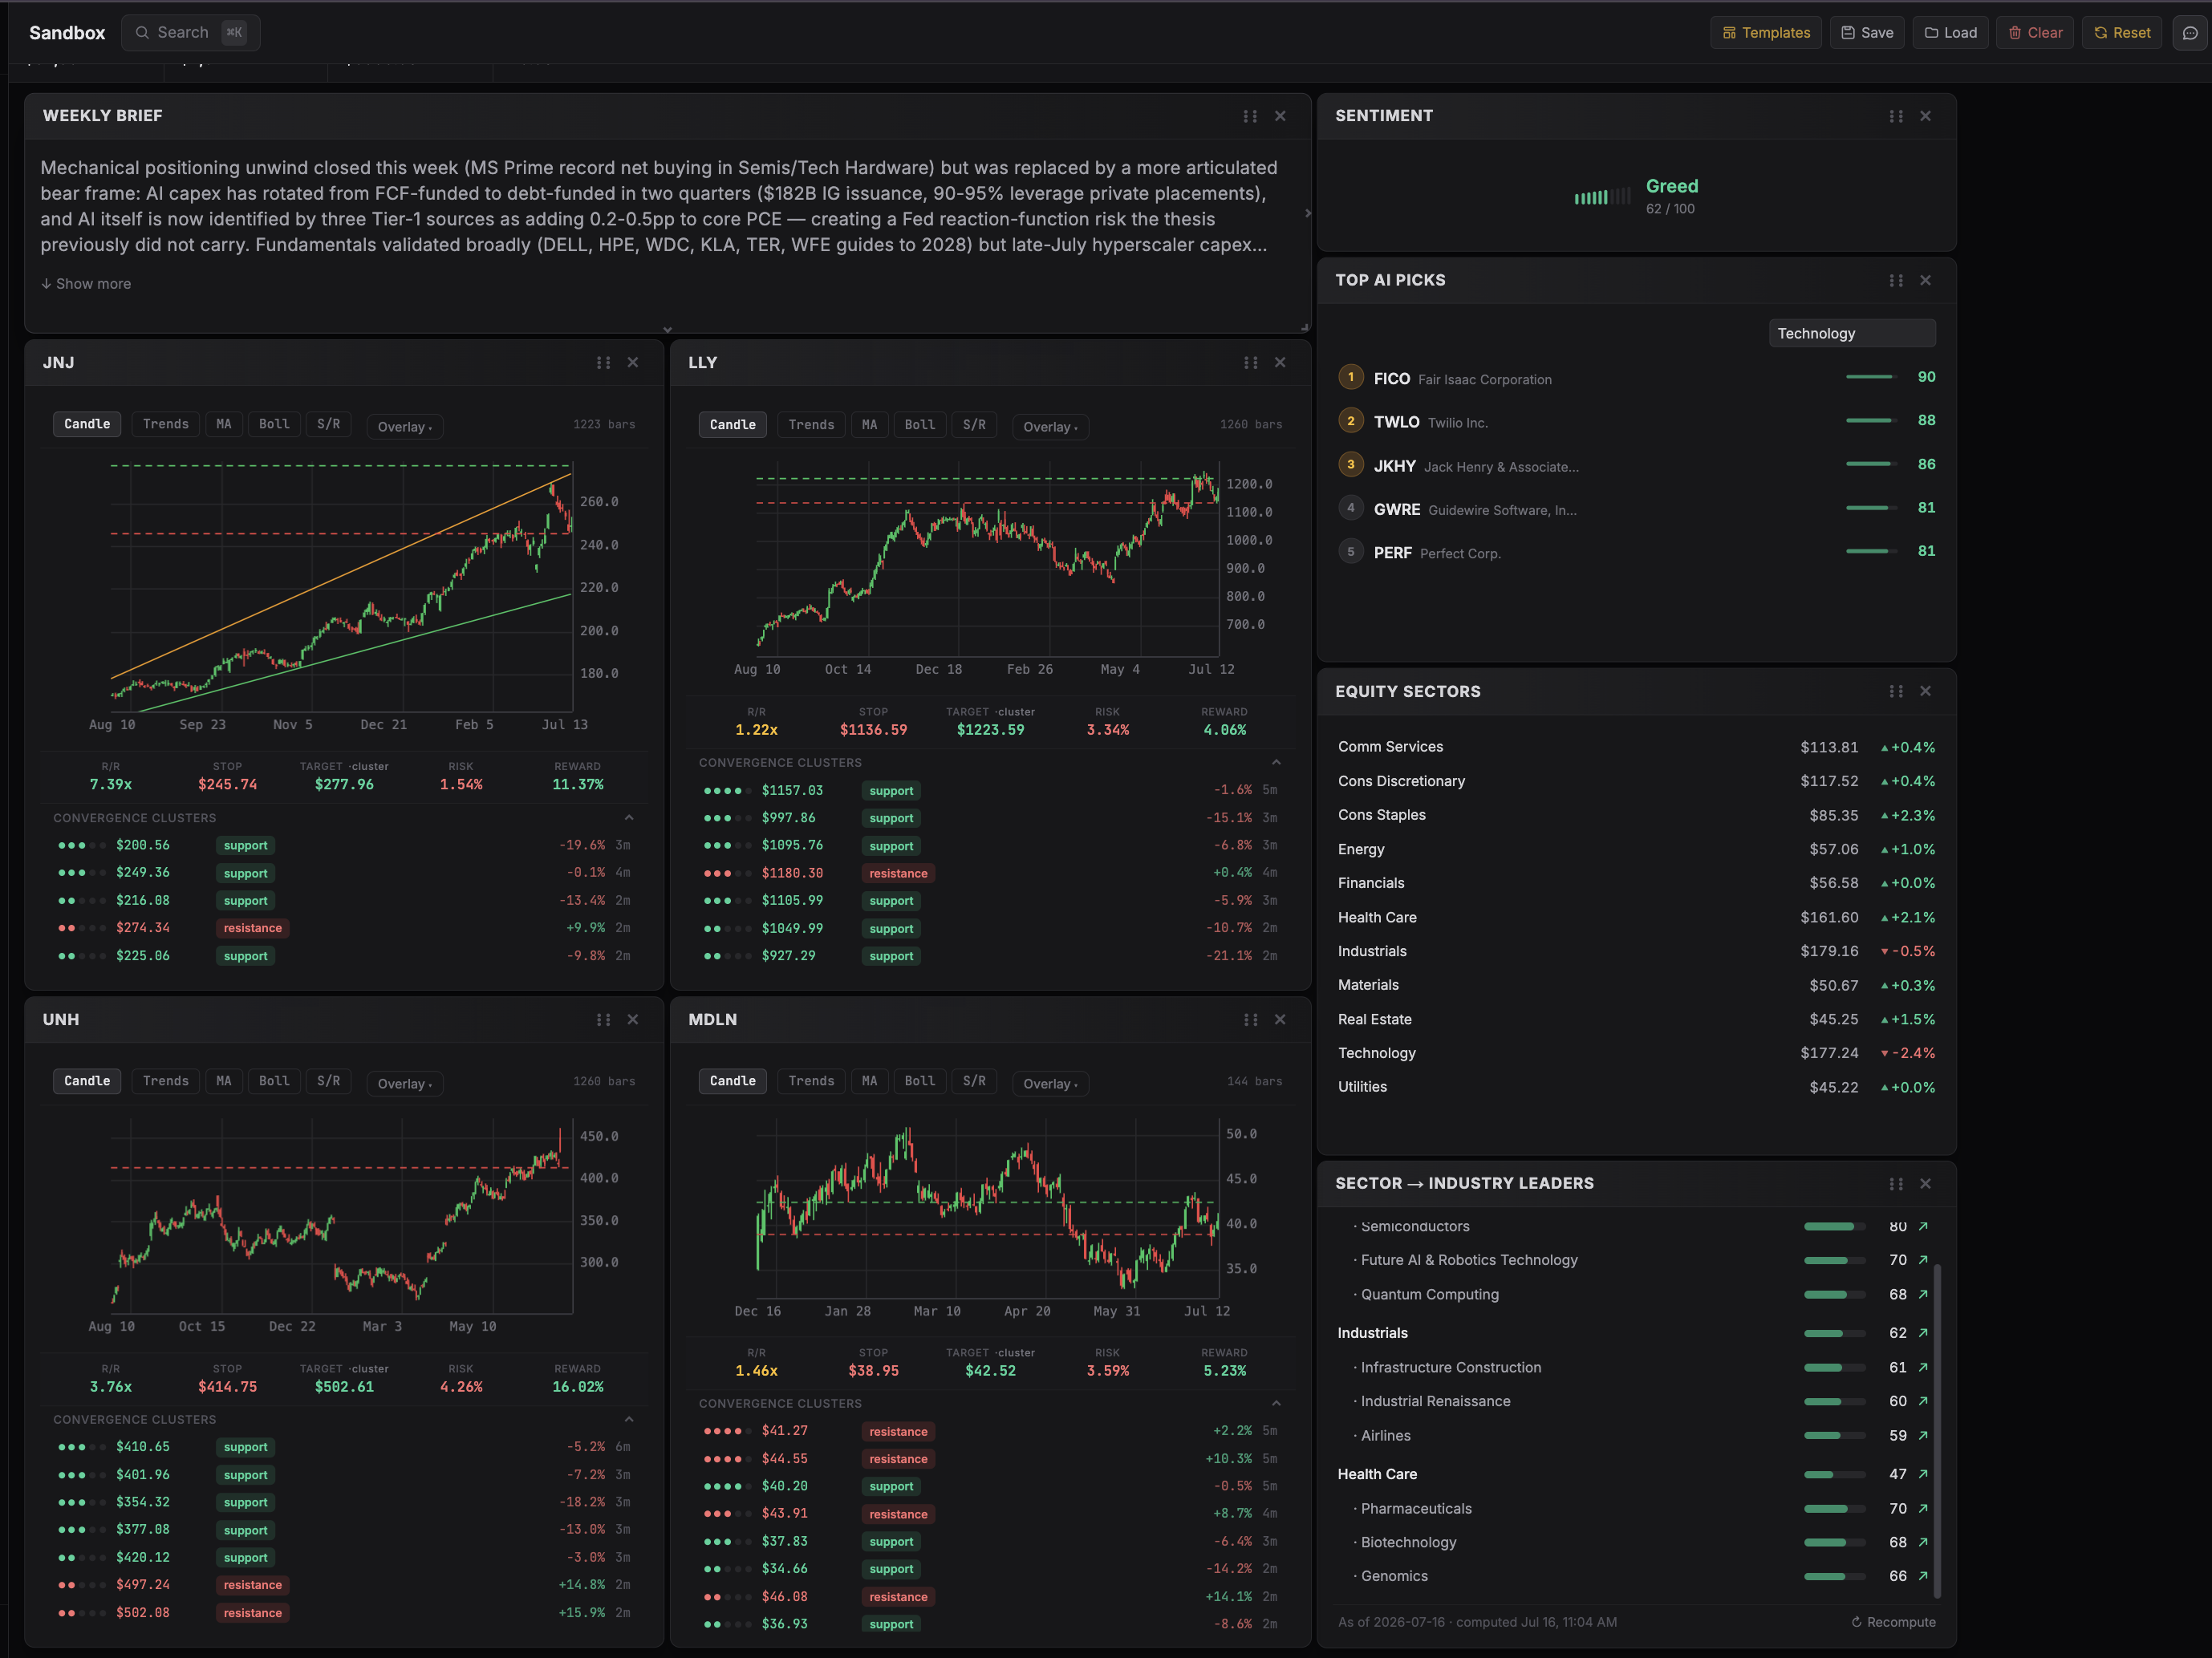
Built a Python (FastAPI) backend that connects to a live brokerage account through a dedicated bridge service, streaming positions, prices, and P&L to a Next.js frontend over WebSockets, with a three-tier cache so the interface renders instantly and degrades gracefully when live data is unavailable. Holdings are organized under a structured thematic taxonomy and rendered as an interactive D3 sunburst, alongside a sector-and-theme market pulse heatmap, allocation and performance views, and a configurable sandbox of chart and analysis tiles. A scheduled data pipeline captures end-of-day marks, corporate actions, financials, macro series, and a large research corpus that is embedded for semantic search. An embedded AI analyst, built on the Claude API with persistent memory and a family of portfolio-aware tools, can answer questions and surface structured analysis directly against the live book.
Result
The system consolidated a fragmented Excel-and-Streamlit workflow into one live platform. It streams a real brokerage book in real time, classifies the full holdings universe under a single thematic taxonomy, maintains a searchable research corpus of thousands of documents, and exposes the whole thing to an AI analyst that reasons over the live portfolio. What used to be a manual reconciliation across half a dozen surfaces is now a single environment that stays current on its own.
What I Learned
The hard part was never the analytics; it was the real-time plumbing. Live brokerage data is fragile, and the difference between a demo and a tool you trust is how gracefully the system behaves when the feed drops, reconnects, or disagrees with itself. Treating the frontend as something that must always render — never blocking on live data, always falling back cleanly — mattered more than any single feature. And an AI analyst is only as good as the tools and memory it is given; the value came from wiring it into the real book, not from the model alone.